After I have spent a lot of time optimizing the Go deflate compression, I found that a lot of my benchmarks were looking like this:
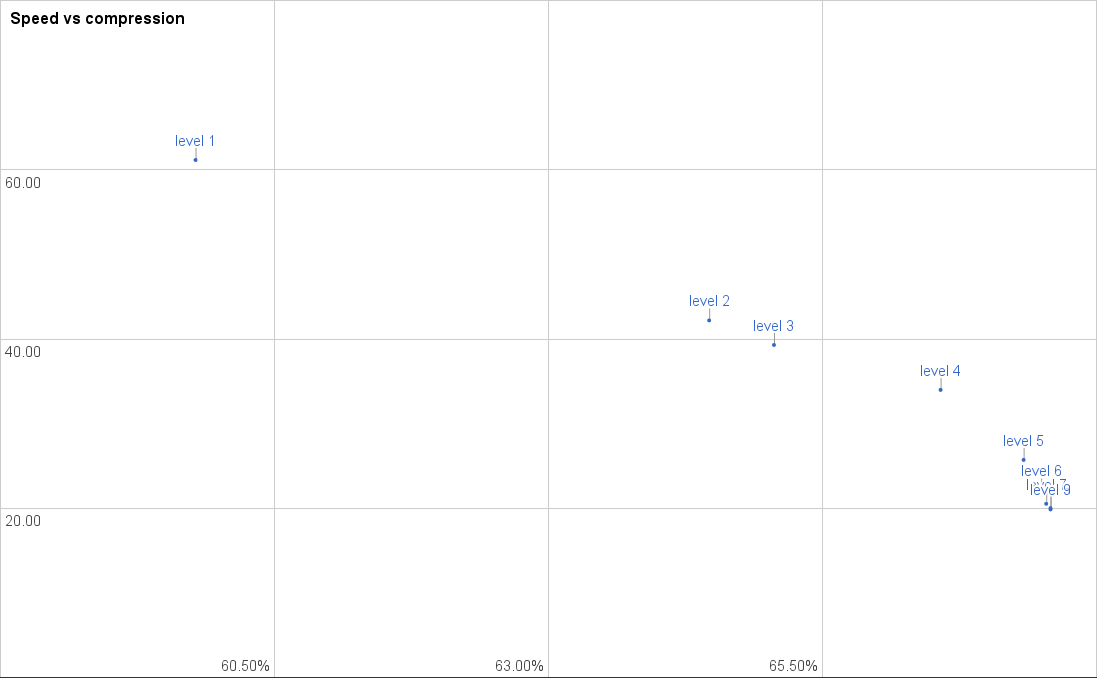
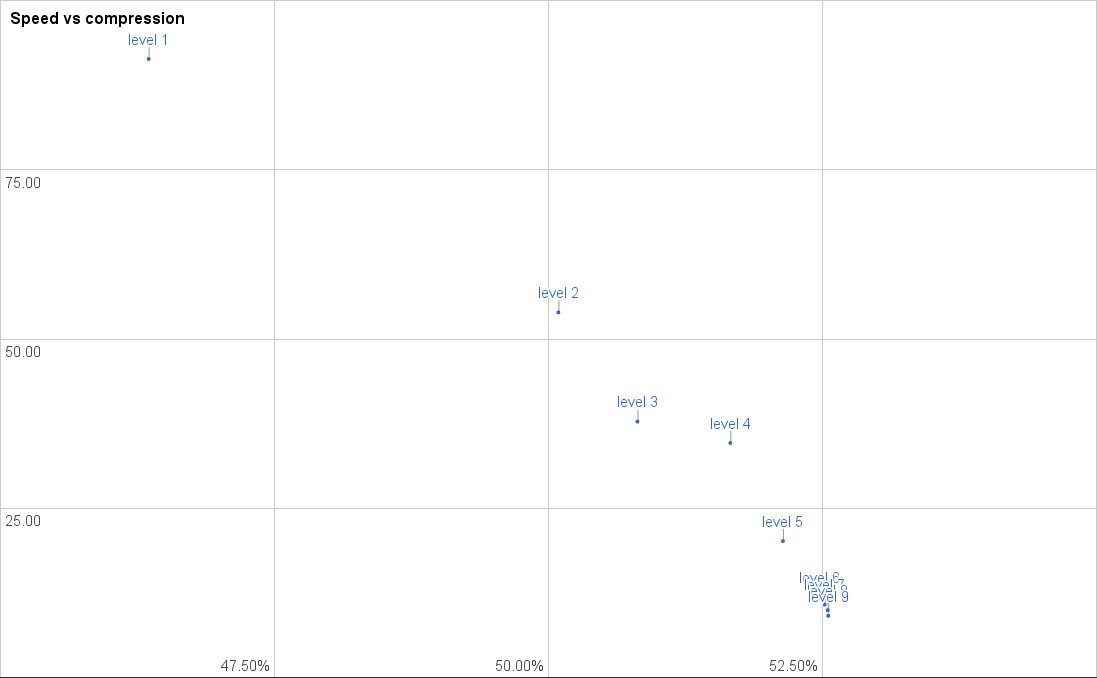
This chart is visualization of a single benchmark. You have the speed up the vertical axis in MB/s. You have the size reduction on the horizontal axis – note that the speed only shows a small range, so a big horizontal jump doesn’t signify more than a few percent of difference.
This graph shows two main problems. First of all, there is a big jump between level 1 and 2. That isn’t unexpected, since level 1 uses a different algorithm highly focused on speed. Second of all, the improvements above level 5 are extremely insignificant. You have no real reason to select a compression level above 5, since the gain is so small. Actually level 4 seems to be the most reasonable setting, since the speed drop to level 5 is very significant (24%, with only 0.7% compression increase). The difference in compression between level 6 (current default) and level 9 (best) is 0.25%, but there is reduction in throughput of 25%. The speed of “level 6” is 0.52x that of level , for a 3% compression improvement, so in effect you use double the CPU usage for a 3% network reduction.
These numbers are of course very much dependent on the type of content. However, if we look at a graph for compression typical web content, the picture is pretty much the same:
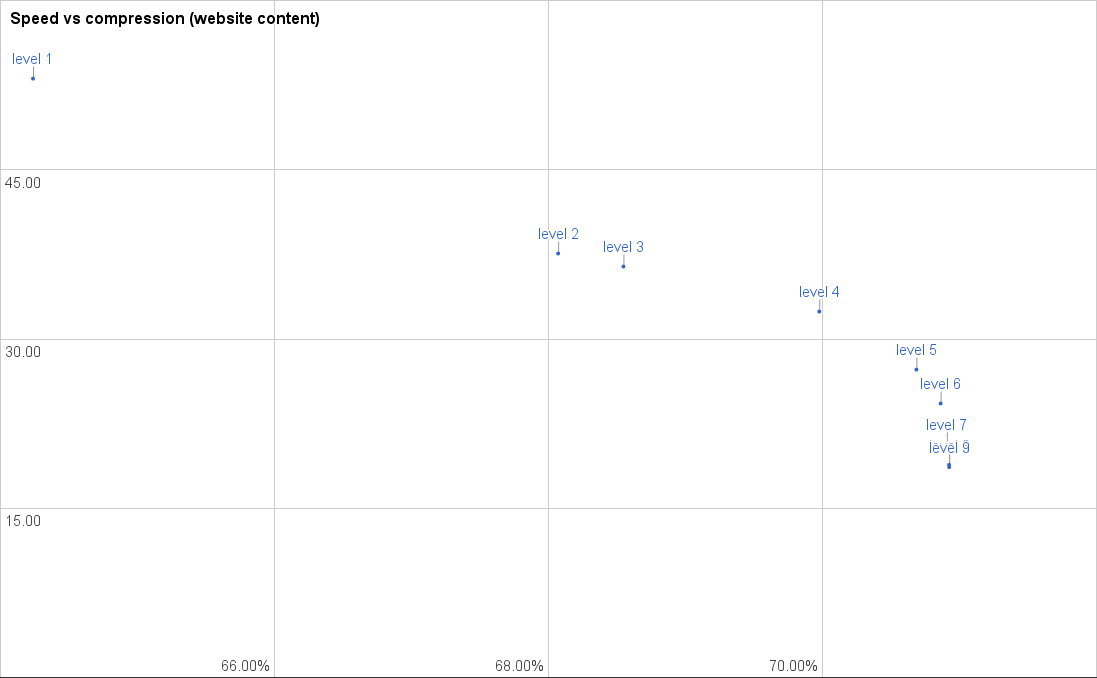
Again, no real improvement above level 5, but a rather big drop-off in speed.
My conclusion was that these trade-offs did not make a deal of sense, and weren’t were clear to the en users. The “default” compression level is unreasonably expensive, and levels 6 to 8 did not have a good trade-off point to justify their presence.
Approach to re-balancing

With this in mind, I set out to re-balance the deflate compression levels, so the trade-offs more clearly reflected the compression level. I set these goals:
- Level 1 and 9 should remain at the current “endpoints”.
- All compression levels should offer a compression improvement over the previous at a reasonable speed cost.
- Speed should be more linear, so selecting ‘5’ speed-wise is between 1 and 9.
Compression is always a business of diminishing returns, where you trade a relatively big computation cost for a small compression improvement. However, if I could achieve something closer to these goals, it would be my impression that choosing a compression level would be more intuitive, and the trade-offs would make more sense.
So, how do re-balance a compression scheme. This is where the ‘art’ of compression comes in. When compressing data, there isn’t a perfect approach. Even with relatively simple algorithms like deflate there are millions of combinations to try. The way to achieve a reasonable speed for webservers and general use is to make some assumptions on using the fewest resources on finding compression opportunities that catch the majority of the cases. This includes stopping searching for previous matches when a “good enough” match has been found. It also includes skipping over data that looks uncompressible, limit the matching precision so we don’t have to allocate gigabytes of memory for compressing a single request.
Adjusting compression levels is not an exact science by far. Some compression tests benefit a lot from a small tweak, because it will suit that data set better. Therefore I based my tests on a few different test sets. ‘enwik9‘ that is an XML dump of wikipedia articles. ‘Matt Mahoneys 10GB corpus‘, which contains a wide variety of files and finally a homemade ‘Webserver test suite‘, that contains 548 typical webserver files, HTML, CSS, Javascript and a lot of small JSON files.
Results
It took quite a few tries to get good and balanced settings. The difficult part is not to super-optimize for a specific speed, when that is really what you are aiming for. If you try that too much, you end up with settings that trade an unreasonable amount of speed for a very small compression improvement. That is only ok, if you are at the very slow settings, ie. level 8 and 9. First up is the first benchmark we looked at above:

It should be clear that the levels are now much better distributed. There are still a few things to note:
- Level 3 doesn’t show a significant speed improvement over level 4, only about 1% speed loss for a 1% compression improvement.
- There is a rather big gap between level 6 and 7. This is a case where we are swicthing algorithms. Level 6 doesn’t use “lazy matching”, but level 7 does. For this test set using lazy matching increases compression by about 1.5%, but reduces throughput with about 30%. I tried to bring these two closer together, but the only thing I achieved was to make level 6 much slower, and only improve compression a little.
- Level 2 is underperforming a little. This will be a general trend, but without a code change level 2 will not get any faster by tweaking settings only.
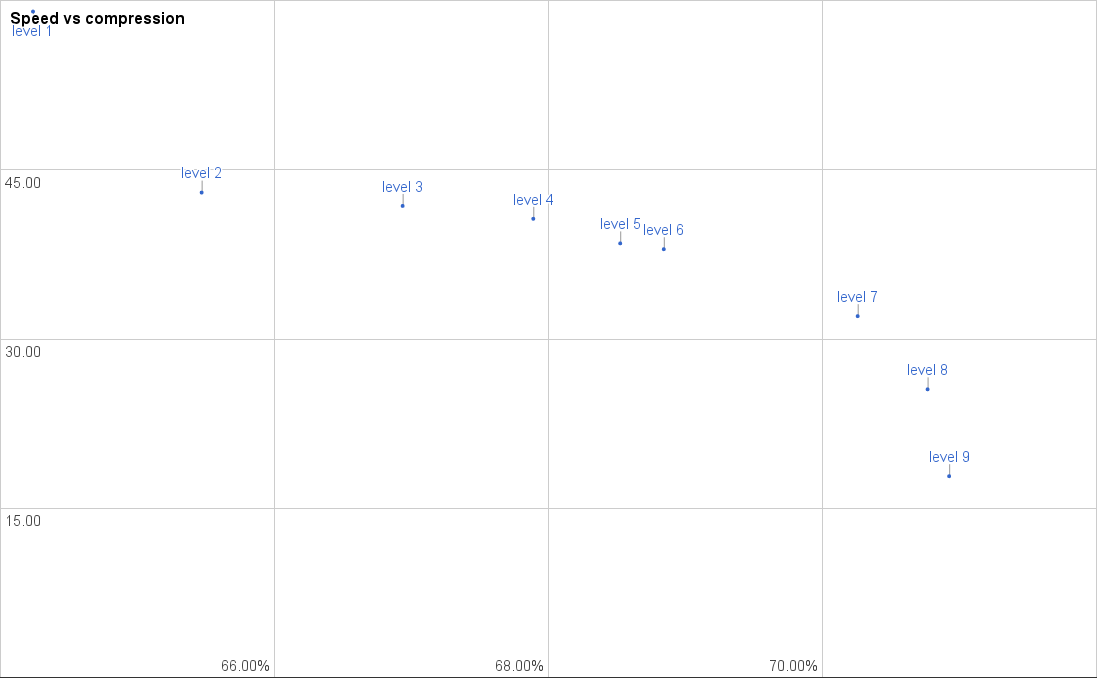
If we look at the revised website benchmark it shows roughly the same picture as ‘enwik9’. The data type is quite similar as well, so that isn’t a big surprise. It is more clear that level 2 is underperforming, but that is something that could be looked at in the future.
Finally, lets look at an example with some different characteristic. The “10GB corpus” is much closer to what a disk image compression would look like, since it contains a wide variety of file types:
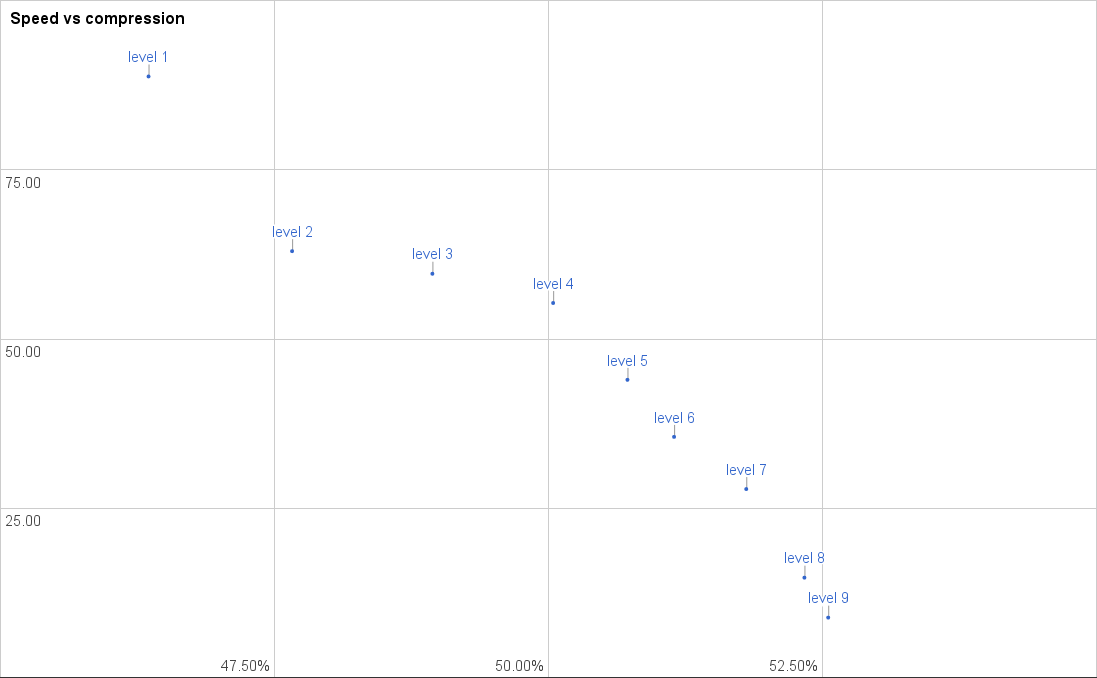
This shows a very good distribution, almost exactly what we were aiming for. The difference is especially visible if we compare this to the “before” chart:
Conclusion
Level 2 is the only compression level that could still need some adjustment, but as mentioned this cannot be achieved without code dedicated to that compression level.
After looking at these charts I have also decided to make level 5 the new default. Level 5 is in most cases the good middle ground in terms of speed vs. compression trade-off, you would want to have as a default. Yes, it will reduce the compression, but the speed will almost be double that of the previous level 6 (the current default). If you include the optimizations over the standard library, it will be about 4 to 5x faster with a 2-5% compression loss.
At the time of writing you can test out the improvements by checking out the PR branch. However, if you read this later, it has likely been merged in a form close to this. I expect this to be part of the code that will be merged into Go 1.7 once the branch opens up after the Go 1.6 release.
If you are interested in the data, the tabs noted with “rebalance” contains the source data for the graphs above. I keep updating this document, so there may be changes that aren’t reflected in the images above.